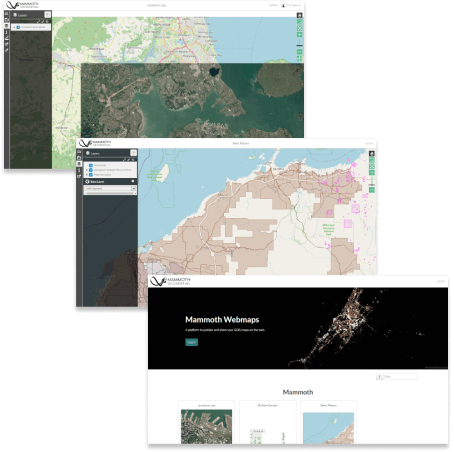
Web Mapping & Applications
For dynamic organisations, managing GIS data can prove challenging and time-consuming.
Maintaining data currency, knowing your users are accessing the correct version, and sharing it with the right people can pose challenges. This is where web mapping is invaluable.
Web mapping is the process of using maps to visualise, oversee, and engage with geospatial data within a browser-centric environment. We're here to help you create dynamic web maps, online data catalogues, or tailored web map applications, all designed to streamline the management of your geospatial data.
Web-based data cataloguing and management
Utilise our specialised GeoNode expertise, enabling you to access features like:
- Data Cataloguing: Upload, organise, and manage various types of geospatial datasets.
- Data Discovery: Search for specific geospatial datasets using keywords, tags, and other search parameters.
- Data Sharing: Share your data and maps with other users, both within an organisation and with the broader public.
- Collaboration: Users can create groups, collaborate on projects, and contribute to shared datasets and maps.
- Access Control: Allows role-based access control.
- Metadata Management: Ensure proper documentation and context for your data.
- Geospatial Services: Supports various geospatial services, including Web Map Service (WMS) and Web Feature Service (WFS).
Create dynamic web maps from QGIS projects
We specialise in deploying solutions using LizMap, a dedicated platform crafted to generate interactive and customisable web mapping applications directly from QGIS projects.
Key features include:
- QGIS Styling and Layout: Retain the styles and cartographic settings from your QGIS project.
- User Friendly Interface: Users can zoom, pan, toggle layers, and explore data.
- Data Exploration: Users can view attributes, apply filters, and perform queries on map features.
- Dynamic Layers: Display data from various sources, including databases and services, providing real-time updates and interaction.
- Charts and Graphs: Integration of charts and graphs, allowing for richer data visualisation and analysis.
- Markup and Annotations: Users can add annotations, notes, and markup directly on the map, enhancing collaborative map review and communication.
- Print and Export: Print maps or export them in various formats, ensuring that map outputs can be easily shared and distributed
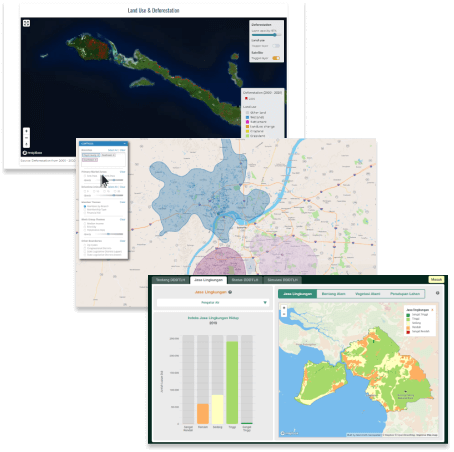
Data storytelling with custom web mapping
At Mammoth Geospatial, we can help you interpret your GIS data to obtain valuable insights, and present it in an intuitive, accessible, and engaging manner. We build beautiful, custom, data-driven web applications, featuring fully interactive maps and graphics.
Web applications can help you:
- Build Captivating Data Visualisations: Integrating maps, interactive dashboards, charts, and graphs.
- Develop Simulations and Modeling: Foster deeper comprehension through simulations and models.
- Share Data with Your Audience: Distribute data to your target audience.
- Create Compelling Narratives: Present information in engaging and impactful narratives.
The team at Mammoth Geospatial has continuously checked the boxes and more. They've done a wonderful job in turning our vision into reality.
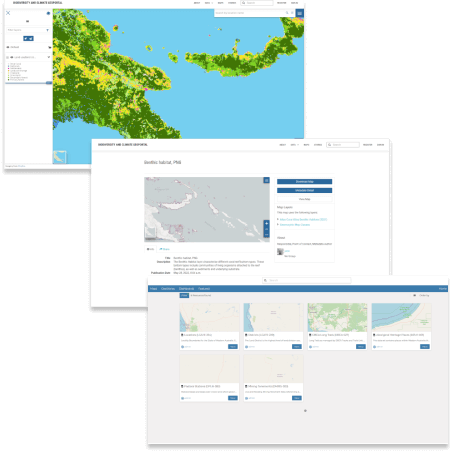
The Biodiversity and Climate Geoportal allows a wide range of users, whether specialized or non-specialized, to connect, share, and visualize spatial data for monitoring and protecting Papua New Guinea's immense and rich biodiversity.